
2021 Global Market Outlook
2020 will always be a year we remember. We will remember fearing the unkown, fearing the known, and of course the masks.
For investors, it was truly a learning opportunity. Markets dropped by -35%, retail sales shut down for many industries, manufacturing collapsed, and the global economy entered into a recession. There was panic, no liquidity, and uncertainty on a sweeping level.
Yet the markets ended 2020 higher.
As financial advisors, we researched many opinions. And in 2020 there were many opinions. If an investor wanted to believe a certain theory, that theory was being discussed.
Arguments assembled using statistics from historical events or economic theories from yesteryear. We have folders full of research from the most respected economists and spent hours researching ideologies.
Nonetheless, it wasn’t that difficult.
Our conviction was cash flows will be higher in the future than they were in March, 2020.
Our approach was to find the best bargains and invest in companies we feel will be leaders no matter what happened on the fiscal and monetary fronts.
Scott Tremlett, CFP®, ChFC® | Managing Partner
When I started my career in as an intern in college, I went through months of education on portfolio strategy:
- ‘The best returns often come from former laggards’
- ‘Combining assets that don’t correlate lowers the overall volatility of a portfolio’
- ‘Sell High, Buy Low’
I am not going to pretend that we foresaw what was in store for the markets, but I will stand by the fact that we held to our fundamentals.
| Nasdaq Composite (NASDAQ) | +43.64% |
| Russell 2000 (IWM) | +20.03% |
| Emerging Markets (EEM) | +17.03% |
| S&P 500 (SPX) | +16.26% |
| US Treasuries (GOVT) | +7.29% |
| Dow Jones (DJI) | +7.25% |
| Crude Oil (USO) | -67.79% |
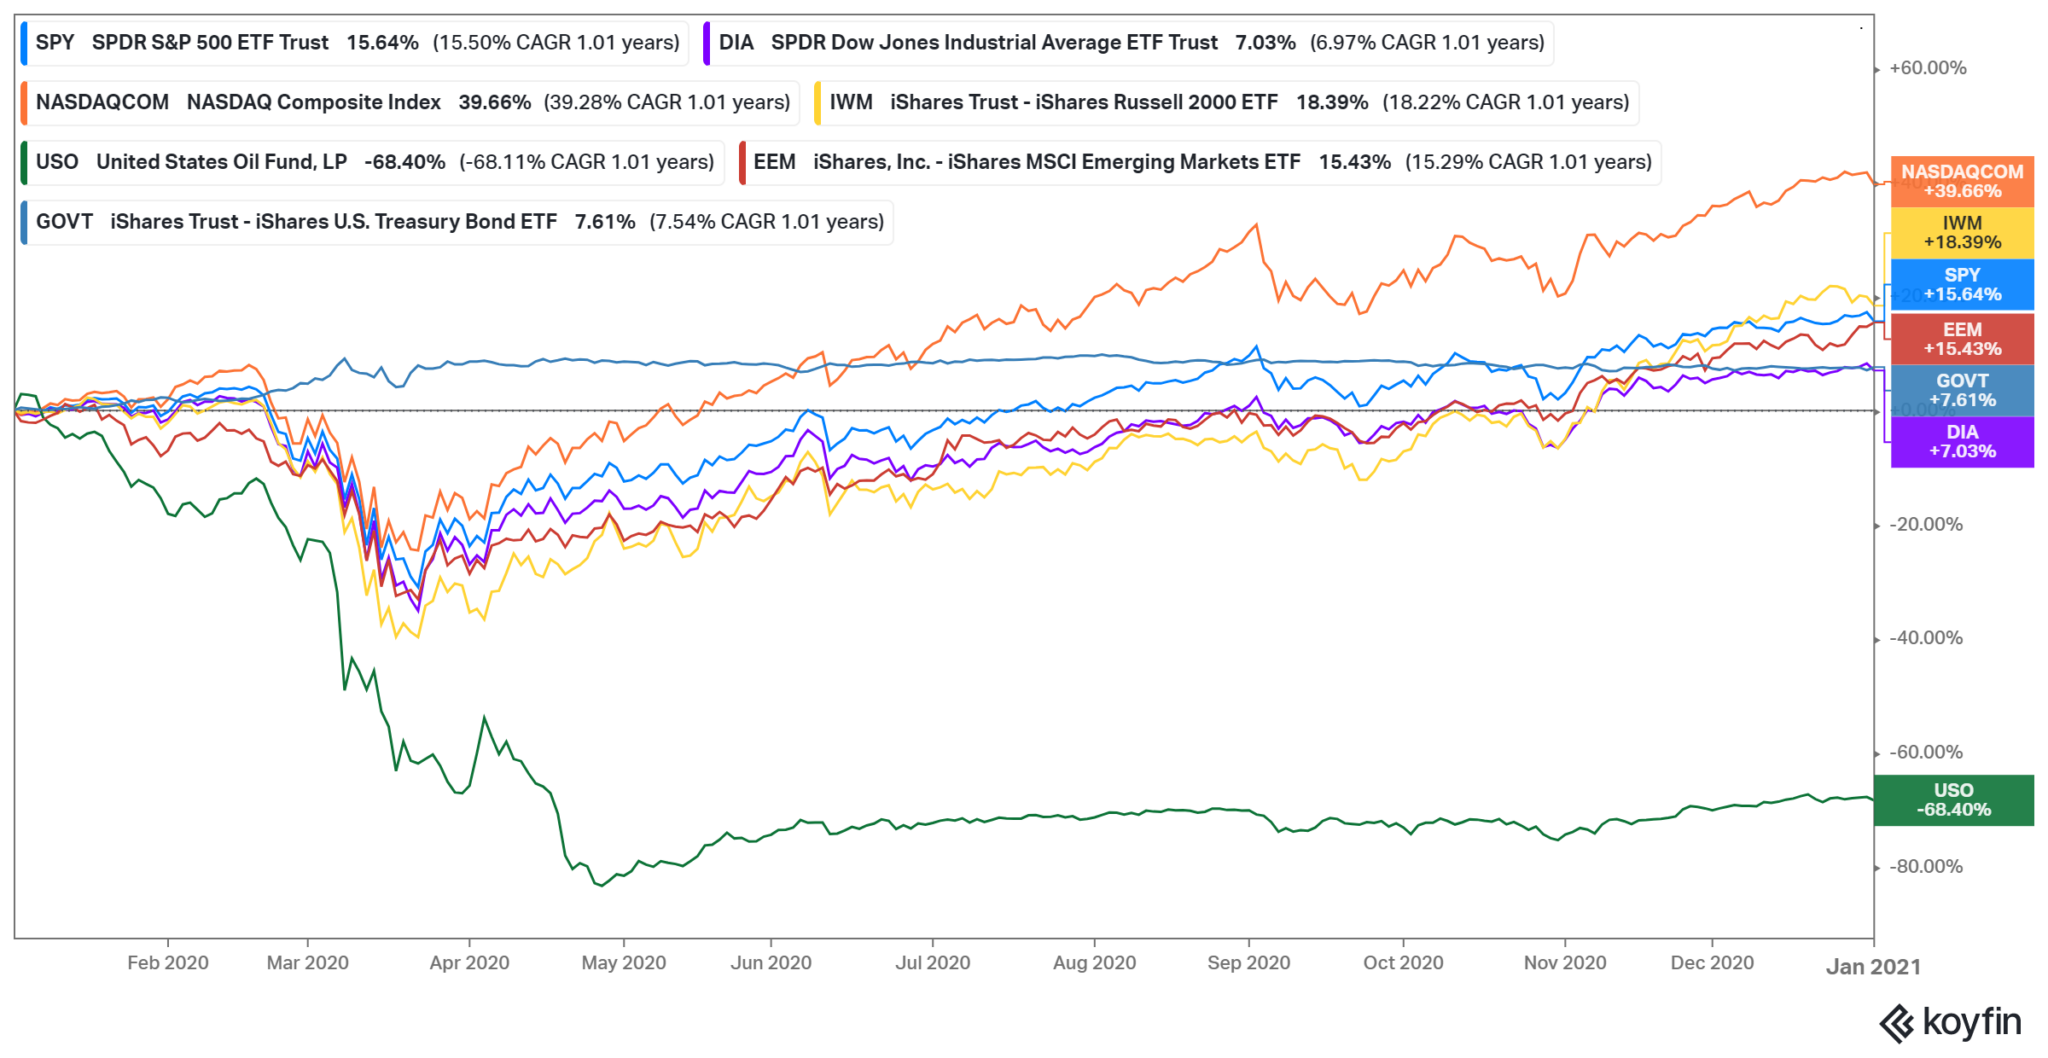
Global Snap Back?
A look at leading indicators:
| Indicator | Summary | ↑ – ↓ |
| J.P. Morgan Global Manufacturing PMI™ Index | Remains among strongest seen in the past decade 4 | Positive ↑ |
| IHS Global Sector PMI™ | Signals higher output in 15 out of 21 sectors 5 | Positive ↑ |
| J.P. Morgan Global Composite PMI™ | 5 out of 6 sub-industries increased in late 2020 – Strongest: Australia, China and the US – Weakest: Euro Area, Japan and Russia | Positive ↑ |
| International Monetary Fund (IMF) | Projecting 5.2% global GDP growth in 2021 – Emerging Markets 6% – Advanced Economies 3.9% | Positive ↑ |
| US: Leading Economic Indicators ® | 9.3% 6-month increase, 80% component advancement 8 | Positive ↑ |
| US: Manufacturing PMI™ | suggests increased business investment spending 9 | Positive ↑ |
| US: IHS Markit US Sector PMI™ | shows 6 of 7 sectors increasing business activity: Healthcare leads, Consumer Services lag 10 | Positive ↑ |
Canada: Manufacturing PMI™ | posts highest result on record 11 | Positive ↑ |
| Brazil: Manufacturing PMI™ | signals sharp increases in sales and production 12 | Positive ↑ |
| Mexico: Manufacturing PMI™ | sharpest decline in history 13 | Negative ↓ |
| Eurozone: Leading Economic Indicators® | fall to contraction levels with 5 consecutive months of decline 14 | Negative ↓ |
| Eurozone: Composite PMI® | illustrates stronger manufacturing, yet significant weakness in services drag the index to negative overall 15 | Negative ↓ |
| Germany: Manufacturing PMI® | strongest since February 2018 16 | Positive ↑ |
| Netherlands: Manufacturing PMI® | strongest improvement since September 2018 17 | Positive ↑ |
| Italy: Manufacturing PMI® | illustrates supply chain shortages slowing growth 18 | Negative ↓ |
| UK: Manufacturing PMI® | rose to 3-year high 19 | Positive ↑ |
| UK: Leading Economic Indicators® | signalling recession 20 | Negative ↓ |
| ASEAN: Manufacuturing PMI™ | growth rate highest seen in 2.5 years 21 | Positive ↑ |
| Asia: IHS Markit Asia Sector PMI™ | 11 of 18 sectors registering higher output, down from 15 in November 22 | Neutral |
| China: Caixin General Services PMI™ | highest business optimism since April 2011 23 | Positive ↑ |
| China: Caixin Geneal Manufacturing PMI™ | rate of expansion remains strong 24 | Positive ↑ |
| China: Leading Economic Indicators® | highest on record 25 | Positive ↑ |
| India: Leading Economic Indicators® | near all-time high 26 | Positive ↑ |
| India: Manufacturing PMI® | illustrates broad strength in sales and output 27 | Positive ↑ |
| Indonesia: IHS Manufacturing PMI® | increases at record rate in November 28 | Positive ↑ |
| Australia: IHS Manufacturing PMI® | nears three-year high 29 | Positive ↑ |
| Japan: IHS Manufacturing PMI® | highest level since April 2019 30 | Positive ↑ |
| Japan: au Jibun Bank Japan Services PMI® | ends 2020 with 11 consecutive months of contracting new business 31 | Negative ↓ |
| Russia: Manufacturing PMI® | illustrates slower contraction during 3 month contraction 32 | Negative ↓ |
| Russia: Services PMI® | shows inflation rose at quickest pace since April 2019 – with firms passing on higher costs to customers 33 | Neutral |
| South Korea: Leading Economic Indicators® | highest on record 34 | Positive ↑ |
| South Korea: IHS Manufacturing PMI® | highest since February 2011 35 | Positive ↑ |
Paramount Global Rankings
(as of December 2020)

#1. United States
Current Power: 1 – #1 GDP Current
Momentum: 14 – #2 Composite PMI Current
Overall Rank: 1 – Top 5 in every Current Category
Stock prices, initial claims for unemployment insurance, new orders for manufacturing, and residential construction permits largest contributions to positive economic activity.

#2. Canada
Current Power: 4 – #4 Manufacturing PMI Current
Momentum: 2 – 3 Manufacturing PMI Momentum
Overall Rank: 2 – Top 10 in every Category
Strongest overall improvement in business conditions on record. New orders and output have led to hiring increases. Material shortages and strong inflationary pressures reduce profit margins.

#3. India
Current Power: 2 – #3 Leading Economic Indicators Current
Momentum: 13 – #2 GDP Current
Overall Rank: 3 – #4 Composite PMI Current
Broad-based recovery with sales and output expanding. Falling employment is something to monitor however the overall pace is moderate. Factory orders rise for five consecutive months.

#4. Netherlands
Current Power: 6 – #3 Manufacturing PMI Current
Momentum: 4 – #2 Manufacturing PMI Momentum
Overall Rank: 4 – #11 GDP Current & Momentum
Highest Manufacturing PMI in two years. New orders increase at fastest rate since February 2018. Firms are not able to keep up with the rate of improving demand and this may lead to more hiring.

#5. China
Current Power: 5 – #1 Leading Economic Indicators Current
Momentum: 9 – #1 Composite PMI Current
Overall Rank: 5 – #2 GDP Growth
2 GDP growth, overall GDP #16 of 18. Manufacturing companies cautious with employment levels amid rising costs. Service sector confidence remains robust with highest reading since April 2011.

#6. Australia
Current Power: 8 – #3 Composite PMI Current
Momentum: 4 – #4 Leading Economic Indicators Current
Overall Rank: 6 – Top 5, 3 of 4 Momentum Factors
Jobs growth strongest in over two years. Output growth second-fastest in two years. Growth in service sectors has encouraged firms to hire additional staff. Businesses remain optimistic about 2021.

#7. Germany
Current Power: 6 – #2 Manufacturing PMI Current
Momentum: 9 – #3 Composite PMI Momentum
Overall Rank: 7 – Top 10 all Categories (Current, Momentum)
Service business expectations highest since March 2019. Manufacturing PMI at 34-month high. Hiring rises slightly in Service sector, decreasing in Manufacturing.

#8. Brazil
Current Power: 3 – #2 Leading Economic Indicators Current
Momentum: 17 – #1 Manufacturing PMI Current
Overall Rank: 8 – #18 GDP & Manufacturing PMI Momentum
Companies have increased production to build inventories with expected increases in demand. Service firms increasingly confident with new work expanding for 5 consecutive months.
Wall Street Says
More than 40% see the S&P 500 between 3,900 – 4,099 by year-end 36
More than 65% think that we will have a full recovery in 2021 36
More than 70% say the 10-year Treasury yield will be between 1.0%-1.50% by year-end 36
More than 70% believe inflation (CPI) to be below 2% in 2021 36
Approximately 80% believe inflation will remain between 1.50%-2.50% for the next 10 years 36
Near record cash on sidelines, in November there was $4.7 trillion in money market balances – the #1 asset class in terms of asset flows for 2020 37
Amount of negative-yielding debt increased by nearly 33% in 2020 to $18 trillion 37
As of October 31, 2020 US consumers amassed almost $1 trillion in excess savings through 30% spending decreases and 70% increase in income 38

Market Outlook, 2021
We previously haven’t entered a recession with GDP falling -31.4%a one quarter and is up +33.4%a the next. Or US Services PMI dropping by approximately 50%a and then growing above trend 3 months later.
Yet, that’s what happened in 2020.
Investors learned first-hand that the US consumer, and the US economy, will bounce back.
There will be volatility in the future and investors need to recall 2020. Normal events don’t create such a robust learning experience as 2020 did.
That brings us to 2021 – with new policies, new momentum, and new headlines. Unlike 10 months ago, the consensus view is now a V-shaped recovery.
As for stocks, it is time for earnings to catch up to prices in certain areas. It may also be the time when the best returns come from former laggards.
(1) We prefer US equities to overseas equities.
(2) We prefer emerging markets to Europe and Japan.
(3) We think we will see moderate inflation in 2021 – potentially reaching the Federal Reserve’s 2% target and then stabilization.
(4) We think that treasury yields will slowly increase.
(5) We believe that select cyclical and economically sensitive stocks will outperform.
(6) We believe in quality across all investments.
(1) US > OVERSEAS
The US is showing relative strength in every category. US earnings are expected to accelerate. The Federal Reserve will continue to provide liquidity to the US markets. We see technology offering exposure to structural growth trends, and US small caps benefiting from a cyclical upturn.
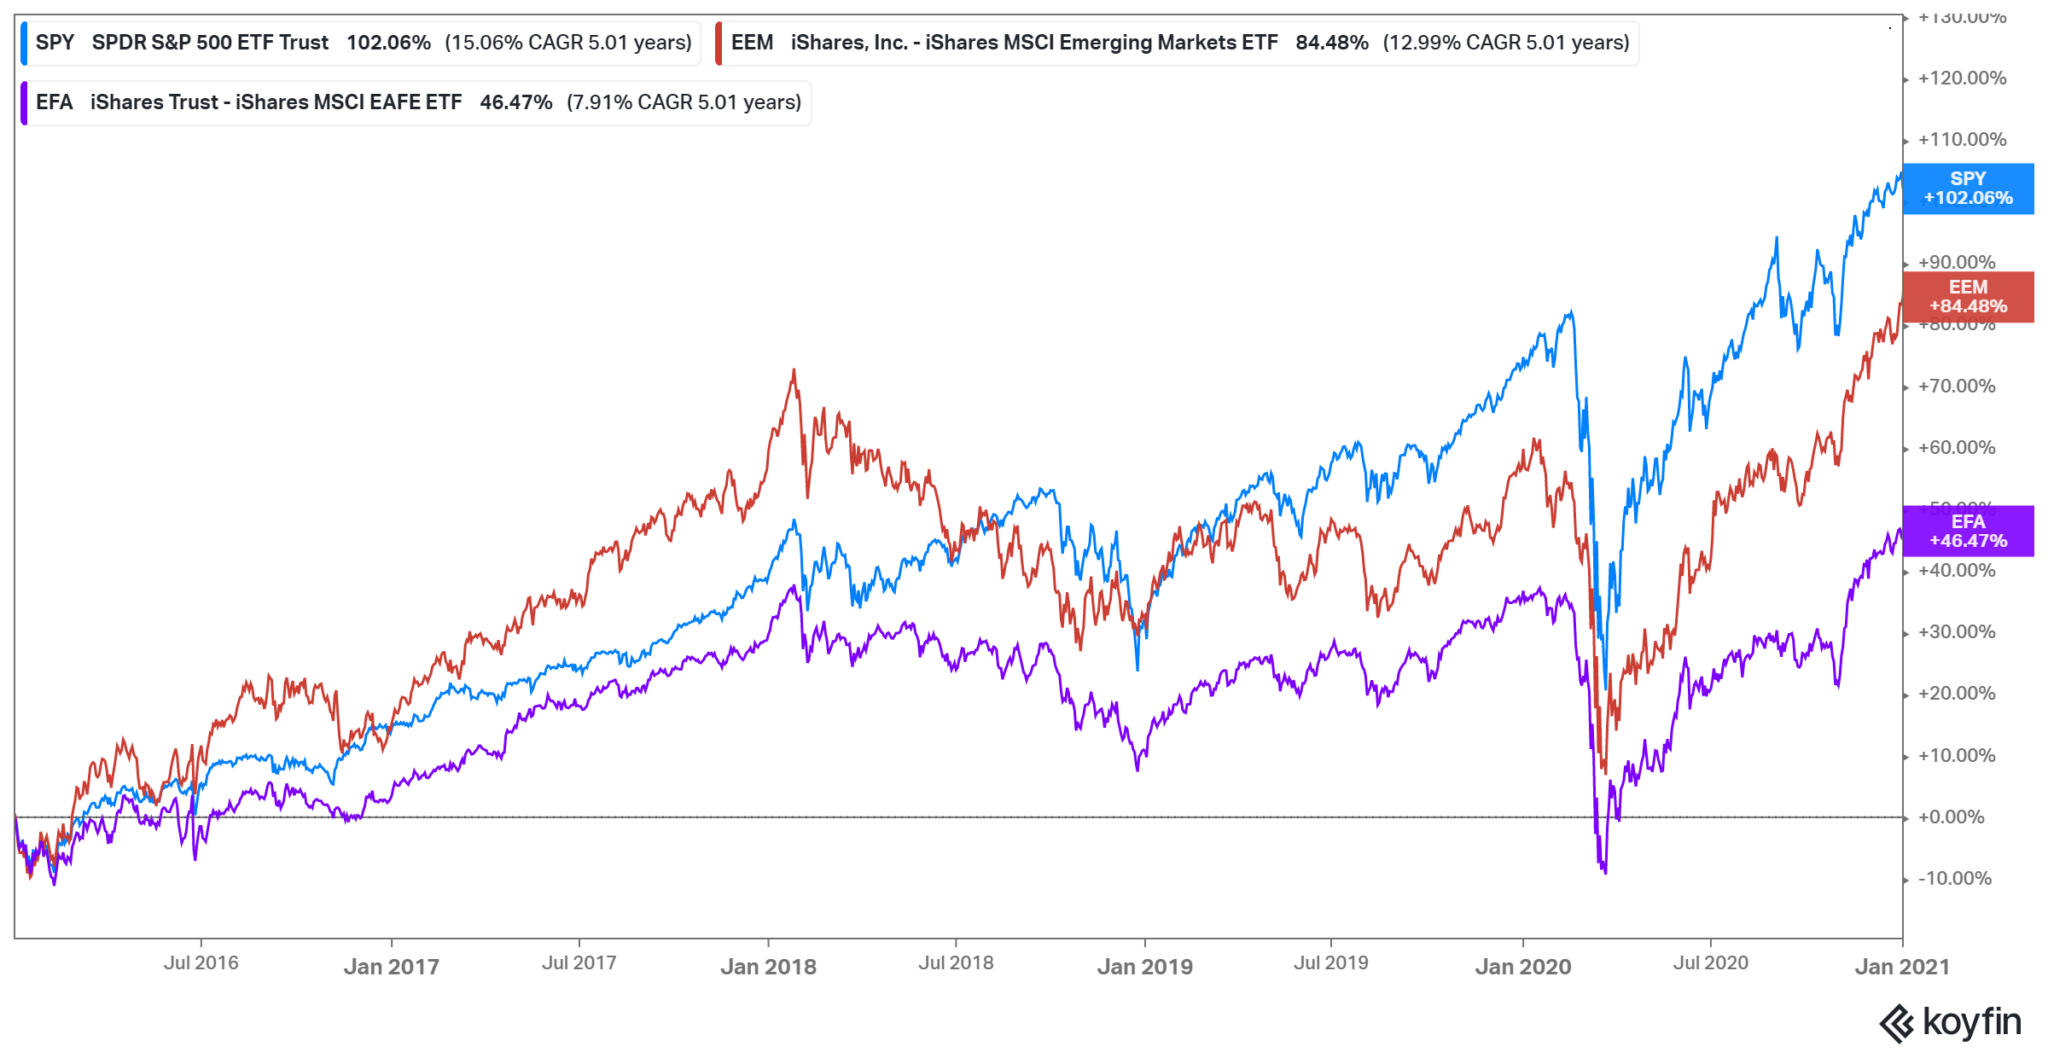
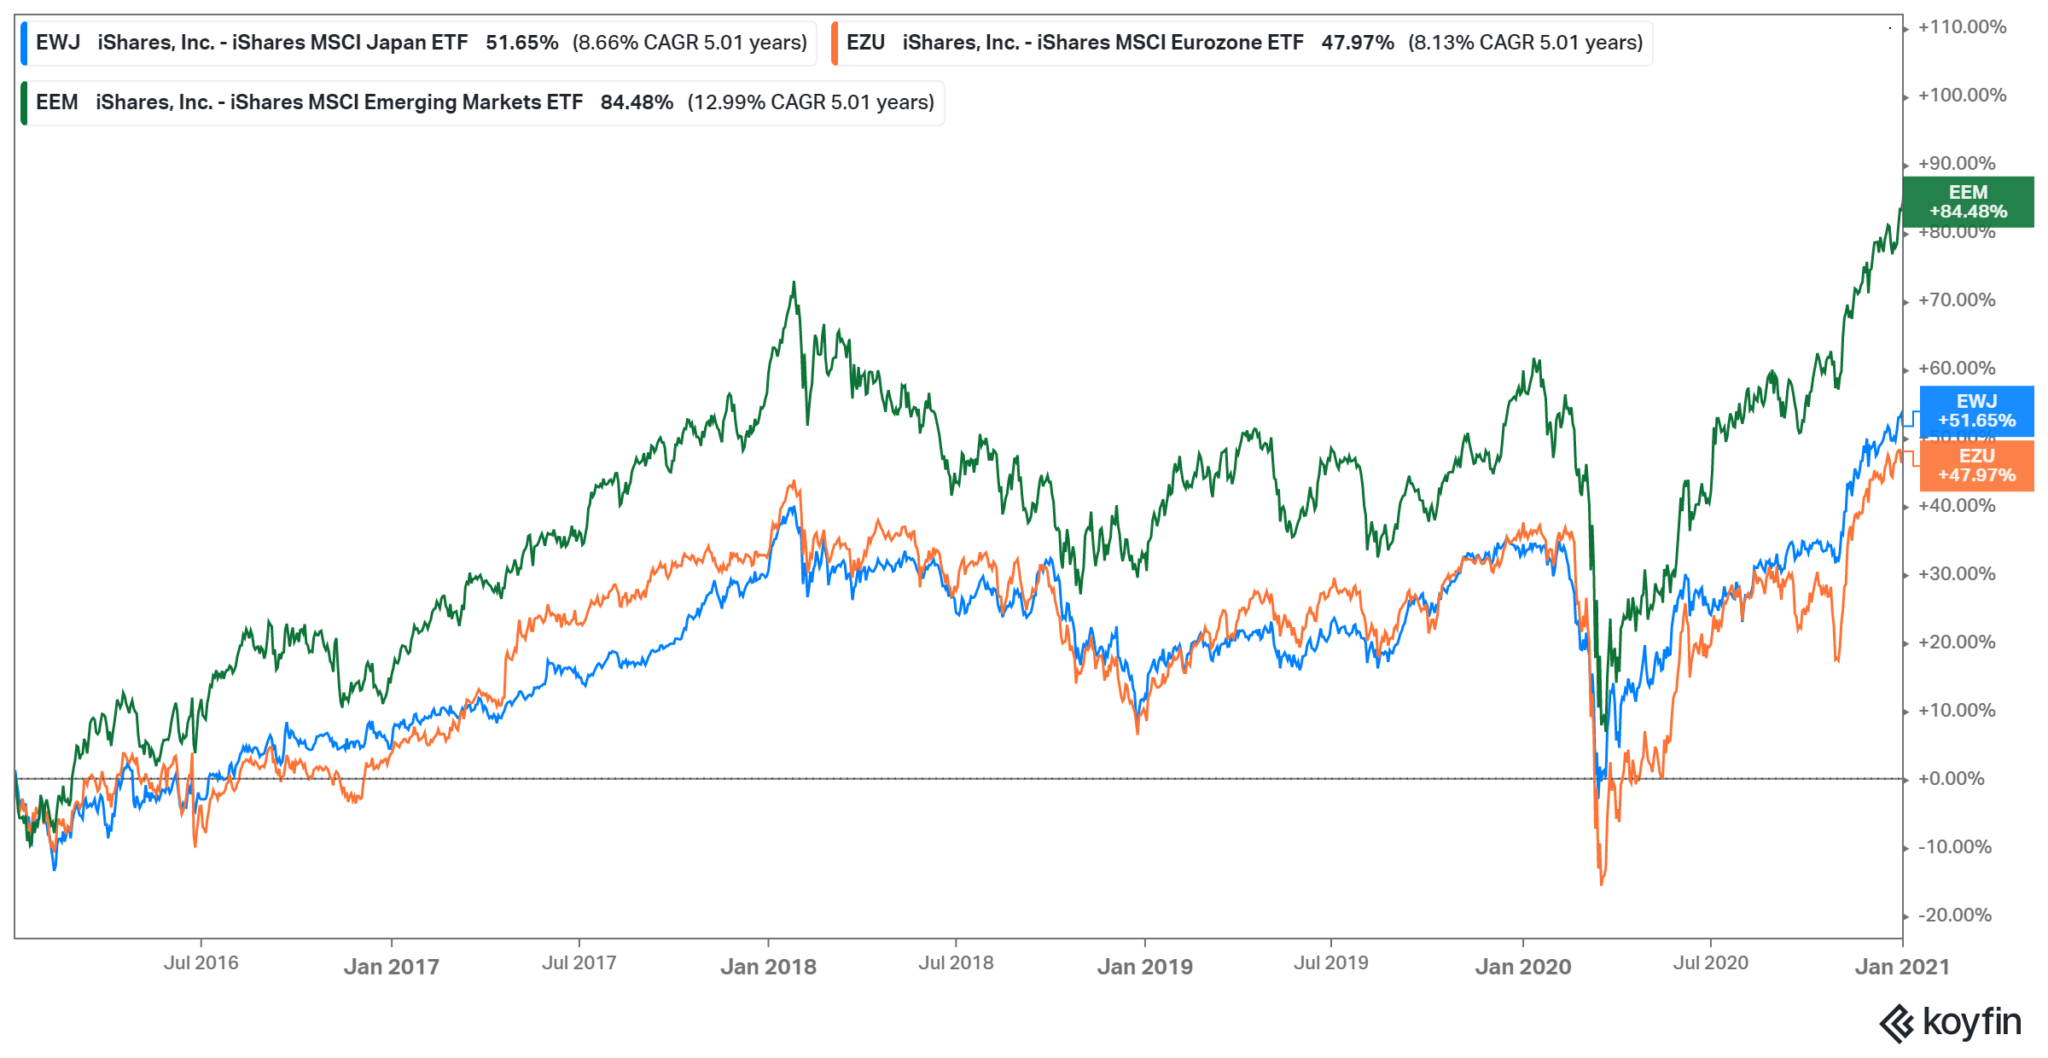
(2) EMERGING MARKETS
Many Asian countries have effectively contained the virus and China appears to have completed the V-shaped recovery. EM benefactors of a weaker US dollar and more stable trade policy. EM earnings heavily weighted to technology, industrials, and materials = positive. Europe earnings heavily weighted to financials = negative.
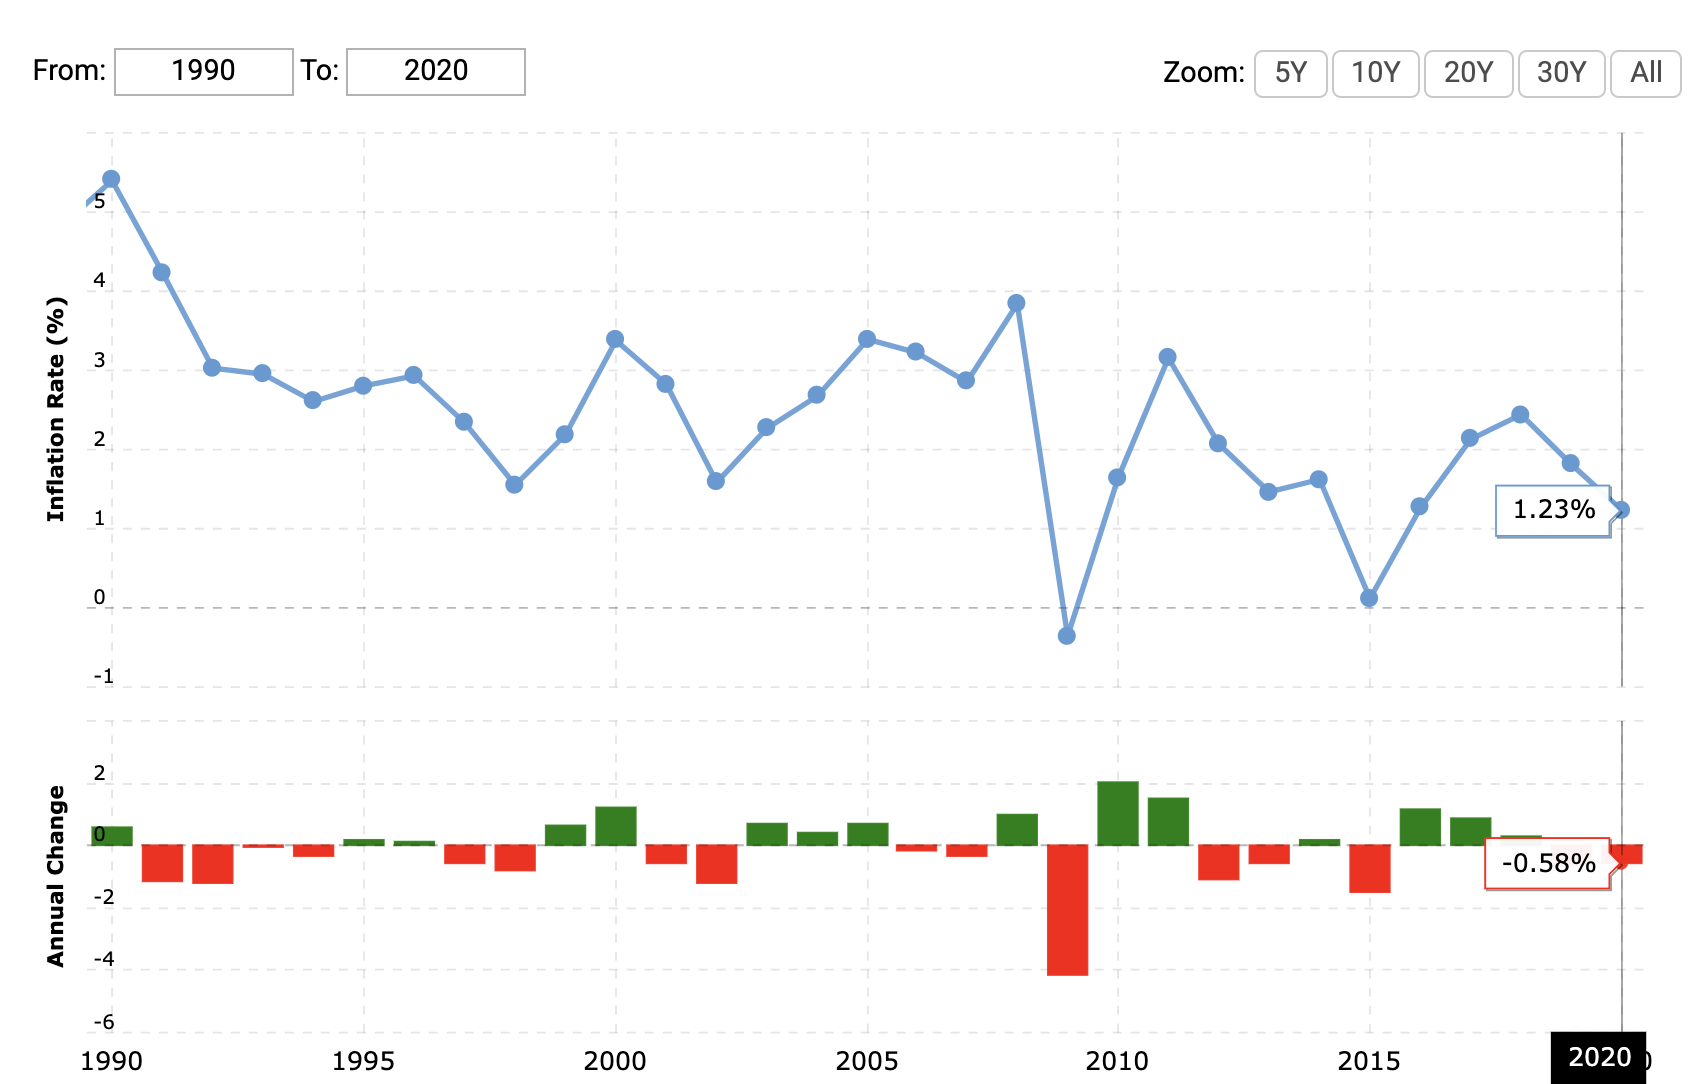
(3) MODERATE INFLATION
Pandemic-driven supply disruption and demand will be offset by unemployment, high personal savings, and the amount of slack in the economy. Inflation has rarely exceeded 2% over the past 10 years.
(4) INCREASE IN YIELDS
Stronger growth and inflation typically increase bond yields. Fiscal policy is expected to increase money supply.
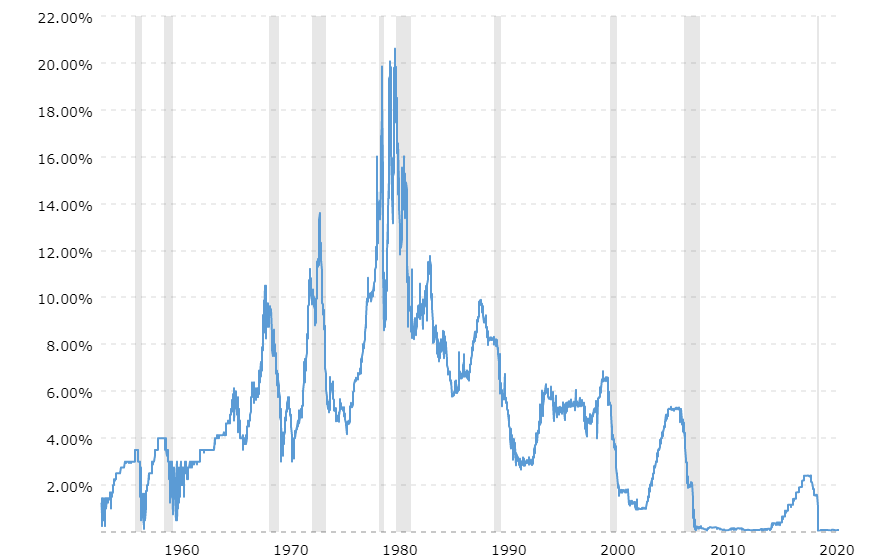
(5) BARBELL INVESTMENT PHILOSOPHY
We see technology maintaining its strength in spite of industrials, consumer discretionary, and materials expected to lead 2021 in YoY EPS growth. This is partially due to the striking 2020 EPS reductions in these areas and the repressed demand. It is important to have a balance between growth and value, and to monitor small caps versus large caps.
(6) QUALITY PREFERENCE
Higher valuations require companies to show better results. Quality offers more fundamental support while some momentum stocks are at risk due to extreme valuations.
Investor Education
WHAT IS LIQUIDITY?
Liquidity describes the degree to which assets can be quickly bought or sold in the market price without affecting the asset’s market price. Cash is the most liquid asset and generally assets such as real estate, fine art, and collectibles, are considered illiquid.
HOW CAN YOU TELL WHEN AN INVESTMENT IS LIQUID OR ILLIQUID?
Investors are able to look at the SPREAD between the BID PRICE and the ASK PRICE.
The wider the SPREAD the less liquidity.
WHAT IS THE BID PRICE? ASK PRICE?
Remember – for every buyer there is a seller.
The BID PRICE is the price the buyer is willing to pay.
The ASK PRICE is the price the seller is willing to accept as payment.
HOW DOES THE FEDERAL RESERVE AFFECT LIQUIDITY?
The Federal Reserve manages the nation’s money supply through the use of:
(1) Setting Bank Reserve Requirements
(2) Setting the Discount Rate
(3) Open Market Operations
BANK RESERVE REQUIREMENTS
The % of reserves a bank is required to hold against deposits. Decreasing the requirement allows banks to lend more, increasing the Money Supply.
DISCOUNT RATE
The interest rate the Fed charges commercial banks that need to borrow additional reserves. Lowering the rate encourages banks to borrow more, increasing the Money Supply.
OPEN MARKET OPERATIONS
Buying / selling government securities by the Fed from large banks / securities dealers. Buying allows the public to sell for cash, increasing the Money Supply.
EXAMPLE OF LIQUIDITY HELPING MARKETS IN 2020:
this is for illustration purposes only
- 2020 started with approximately $26.5 trillion in assets in US mutual funds
- Let’s assume that 30% of the assets were balanced 60% equity funds & 40% bond funds. These holdings are typically rebalanced the last week of each quarter
- Using these figures we get $4.77 trillion in equity funds & $3.18 trillion in bond funds
- Through March 23, 2020 the S&P Index was down -30.75% and through March 23, 2020 10-Year US Treasuries were were up +9.65%
- Due to market fluctuation the 60% equity fund & 40% bond fund allocation is now 48% equity funds and 52% bond funds
- Using this scenario, from March 23rd-31st a total of $770 billion of bond sales was necessary to rebalance to the 60% / 40% allocation
- On the 23rd the Federal Reserve announced its $1.2 trillion bond buying program
- $770 billion of bond sales were necessary to fund $770 billion of stock buys. When Coronavirus hit the markets, liquidity was insufficient. Highly rated bond funds descended by -10% to -15% without willing bond buyers. Without the Fed adding liquidity – bonds would not have had a buyer, rebalancing would not have been possible, and markets would not have bounced back as quickly as they did
Asset Allocation Review
| US Equity: | Positive |
| Developed Int’l Equity: | Negative |
| Emerging Markets Equity: | Positive |
| US Government Bond: | Negative |
| US Corporate Bond: Neutral | Neutral |
| International Bond: | Sell |
| Emerging Markets Bond: | Negative |
| REIT/Commodity: | Neutral |
| Preferred Sectors: | Technology, Industrials |
Allocation Update
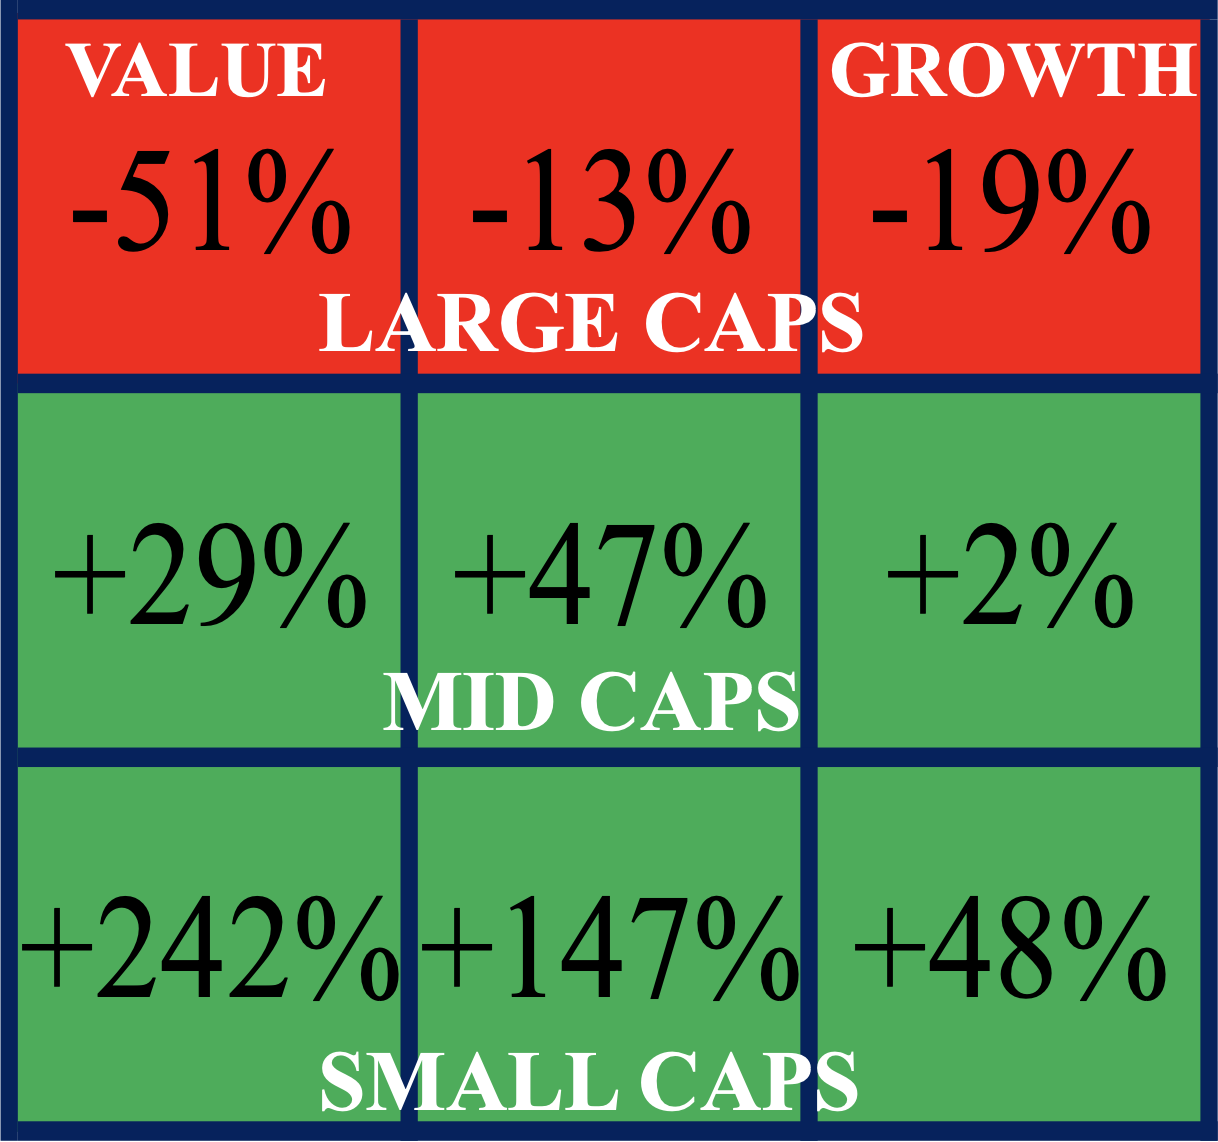
In November 2020 we discussed reducing Large Cap equities and increasing Small Cap equities.
Here’s how the overall allocation has changed since November 2020 using a Morningstar Style Box.
Sector Exposure
- TECHNOLOGY
- CONSUMER CYCLICAL
- INDUSTRIALS
- HEALTHCARE
- CONSUMER DEFENSIVE
Equity Exposure
- Uber
- Bill.com
- MercadoLibre
- Amazon
- Livent
- Nvidia
- DocuSign
- Apple
- Nike
- Group 1 Automotive
- Assurant
- Morgan Stanley
- Cloudflare
- Kratos Defense & Security
- Avalara
- Adobe
- Microsoft
- Fortress Transportation & Infrastructure
- Southwest Airlines
- Big Lots
REFERENCES
1 morningstar.com, accessed 1/01/2021
2 MSCI.com, Index Data Search, accessed 1/05/2021
3 Bloomberg.com, Index Fact Sheets, accessed 1/05/2021
4 IHS Markit, J.P. Morgan Global Manufacturing PMITM, accessed 1/06/2021
5 IHS Markit, Global Sector PMITM, accessed 1/07/2021
6 JP Morgan Global Composite PMITM, accessed 1/07/2021
7 International Monetary Fund, IMF DataMapper, accessed 1/19/2021
8 The Conference Board, US Leading Economic Index®, accessed 12/31/2020
9 IHS Markit, U.S. Manufactuing PMITM, accesssed 1/06/2021
10 IHS Markit, U.S. Sector PMITM, accesssed 1/06/2021
11 IHS Markit, Canada Manufacturing PMITM, accessed 1/06/2021
12 IHS Markit, Brazil Manufacturing PMI®, accessed 1/06/2021
13 IHS Markit, Mexico Manufacturing PMITM, accessed 1/06/2021
14 The Conference Board, EuroArea Leading Economic Index®, accessed 12/31/2020
15 IHS Markit, Eurozone Composite PMI® – final data, accessed 1/06/2021
16 IHS Markit, Germany Manufacturing PMI®, accessed 1/06/2021
17 IHS Markit, Netherlands Manufacturing PMI®, accessed 1/06/2021
18 IHS Markit, Italy Manufacturing PMI®, accessed 1/06/2021
19 IHS Markit, UK Manufacturing PMIITM, accessed 1/06/2021
20 The Conference Board, UK Leading Economic Index®, accessed 12/31/2020
21 IHS Markit, ASEAN Manufacutring PMIITM, accessed 1/06/2021
22 IHS Markit, Asia. Sector PMIITM, accesssed 1/06/2021
23 IHS Markit, Caixin China General Services PMIITM, accessed 1/06/2021
24 IHS Markit, Caixin China General Manufacturing PMIITM, 1/05/2021
25 The Conference Board, China Leading Economic Index®, accessed 1/06/2021
26 The Conference Board, India Leading Economic Index®, accessed 1/06/2021
27 IHS Markit, India Manufacturing PMI®, accessed 1/06/2021
28 IHS Markit, Indonesia Manufacutring PMIITM, accessed 12/31/2020
29 IHS Markit, Australia Manufacturing PMIITM, accessed 1/05/2021
30 IHS Markit, Japan Manufacturing PMI®, accessed 1/05/2021
31 au Jibun Bank, au Jibun Bank Japan Services PMI®, 1/06/2021
32 IHS Markit, Russia Manufacturing PMI®, accessed 1/05/2021
33 IHS Markit, Russia Services PMI®, accessed 1/05/2021
34 The Conference Board, Korea Leading Economic Index®,accessed 1/06/2021
35 IHS Markit, South Korea Manufacturing PMI®, accessed 12/31/2020
36 Morgan Stanley, On the Markets, January 2021, accessed 1/15/2021
37 John Hancock, Market Intelligence, January 2021, accessed 1/20/2021
38 Fidelity, 2021 Outlook: Reflation, Reopening, and Readjustment, accessed 1/20/2021
DISCLAIMER
The views expressed represent the opinion of Paramount Associates. The views are subject to change and are not intended as a forecast or guarantee of future results. This material is for informational purposes only. It does not constitute investment advice and is not intended as an endorsement of any specific investment. Stated information is derived from proprietary and non-proprietary sources believed to be correct and current, but it should not be regarded as complete, an endorsement or personalized investment advice. Forward look- ing statements are speculative and based on assumptions as well as known and unknown risk and uncertainties. Past performance is not indicative of future results. The appropriate- ness of an investment or strategy will depend on an investor’s circumstances and objectives. These opinions may not fit to your financial status, risk and return preferences. Nothing contained herein constitutes financial, legal, tax, or any other type of advice. A professional advisor should be consulted before implementing any investment strategy.
Paramount Associates
6400 S. Fiddlers Green Circle Suite 1310
Greenwood Village, CO 80111
(720) 463-0020
general@paramountassoc.com
www.paramountassoc.com
www.linkedin.com/in/paramount-associates-623692197
@paramountassociatesdenver
