Monthly Report: July 2022
What is a Recession?
A recession is an economic term that refers to a significant decline in economic activity in a designated region. Typically, a recession is recognized as two consecutive quarters of declining GDP (Gross Domestic Product) and a rise in unemployment.
For many years, two quarters of declining GDP was the defining factor determining if the U.S. was in a recession. Similarly, for many years an inverted yield curve was a precursor to recession (not today’s focus).
The National Bureau of Economic Research (NBER) was founded in 1920 to present data and research to be used for policy guidance. To be clear, the NBER does not make policy or direct policy recommendations – however, the NBER is the organization which officially declares recessions.
The National Bureau of Economic Research states the two consecutive quarters of decline in real GDP is not a good definition of recession. On the NBER website1 rationale is provided as to what is considered a recession and what is considered “statistical discrepancy”1. The NBER cites the dot.com crash and the 2007-2009 banking collapse in establishing how the changing global economic backdrop drives their modifications to traditional assumptions.
So, what does that mean for our economic thesis? We have researched past economic downturns, periods of rising rates due to Federal Reserve policy and inflation, and phases where economic growth began to slow. Sorting through the economic factors and contributing shocks, we have come to one conclusion – this time is truly different. We have lived through the first pandemic in over a century (this is not a medical judgement and we hope all are safe). Unparalleled stimulus from both monetary and fiscal policies pushed the U.S. economy from 0 to 100 in a number of months. We have witnessed an entire economic cycle in less than two years. Inflation is the highest in decades. Consumer Sentiment is nearing historical lows. Stock markets and Bond markets are moving in tandem to the downside.
Year to date (through 6/30/2022):
- the Dow is down -15.31%2,
- the S&P 500 is -20.58%2 lower,
- the NASDAQ is -29.51%2 lower,
- and even Bonds (measured by AGG, iShares Core US Aggregate Bond ETF) are -10.16%3 lower.
Investors (and media) seem focused on ‘who is to blame?’.
My answer – “it doesn’t matter”. This is where we are, and the focus needs to be on ‘what comes next?’.
Here is my thesis:
INFLATION: The Federal Reserve will not need to move rates as much as the market is pricing in. I expect inflation to moderate due to reduced demand. Recent surveys highlight the cushion from past stimulus checks is no longer. Retail consumers have used those funds for purchases and with rates increasing on credit instruments, liquidity will (or has already) dry up. There is evidence (Walmart, Target, Costco to name a few) that lower income households are spending less and the rising price of goods is cutting into retail margins. There is a point where the consumer is unwilling to purchase goods at increased prices. We have seen this in the housing market as home prices and mortgages have become more expensive. When it is more difficult and more expensive to get money, demand should falter. The Federal Reserve will raise rates until there is evidence that inflation is under control and we expect that sooner than the markets are anticipating.
The chart below contains popular food and gas indices. These prices change with the most volatility of any input within the Consumer Price Index. Not yet has the trend reversed overall; however we are seeing proof that prices are no longer increasing from past highs.
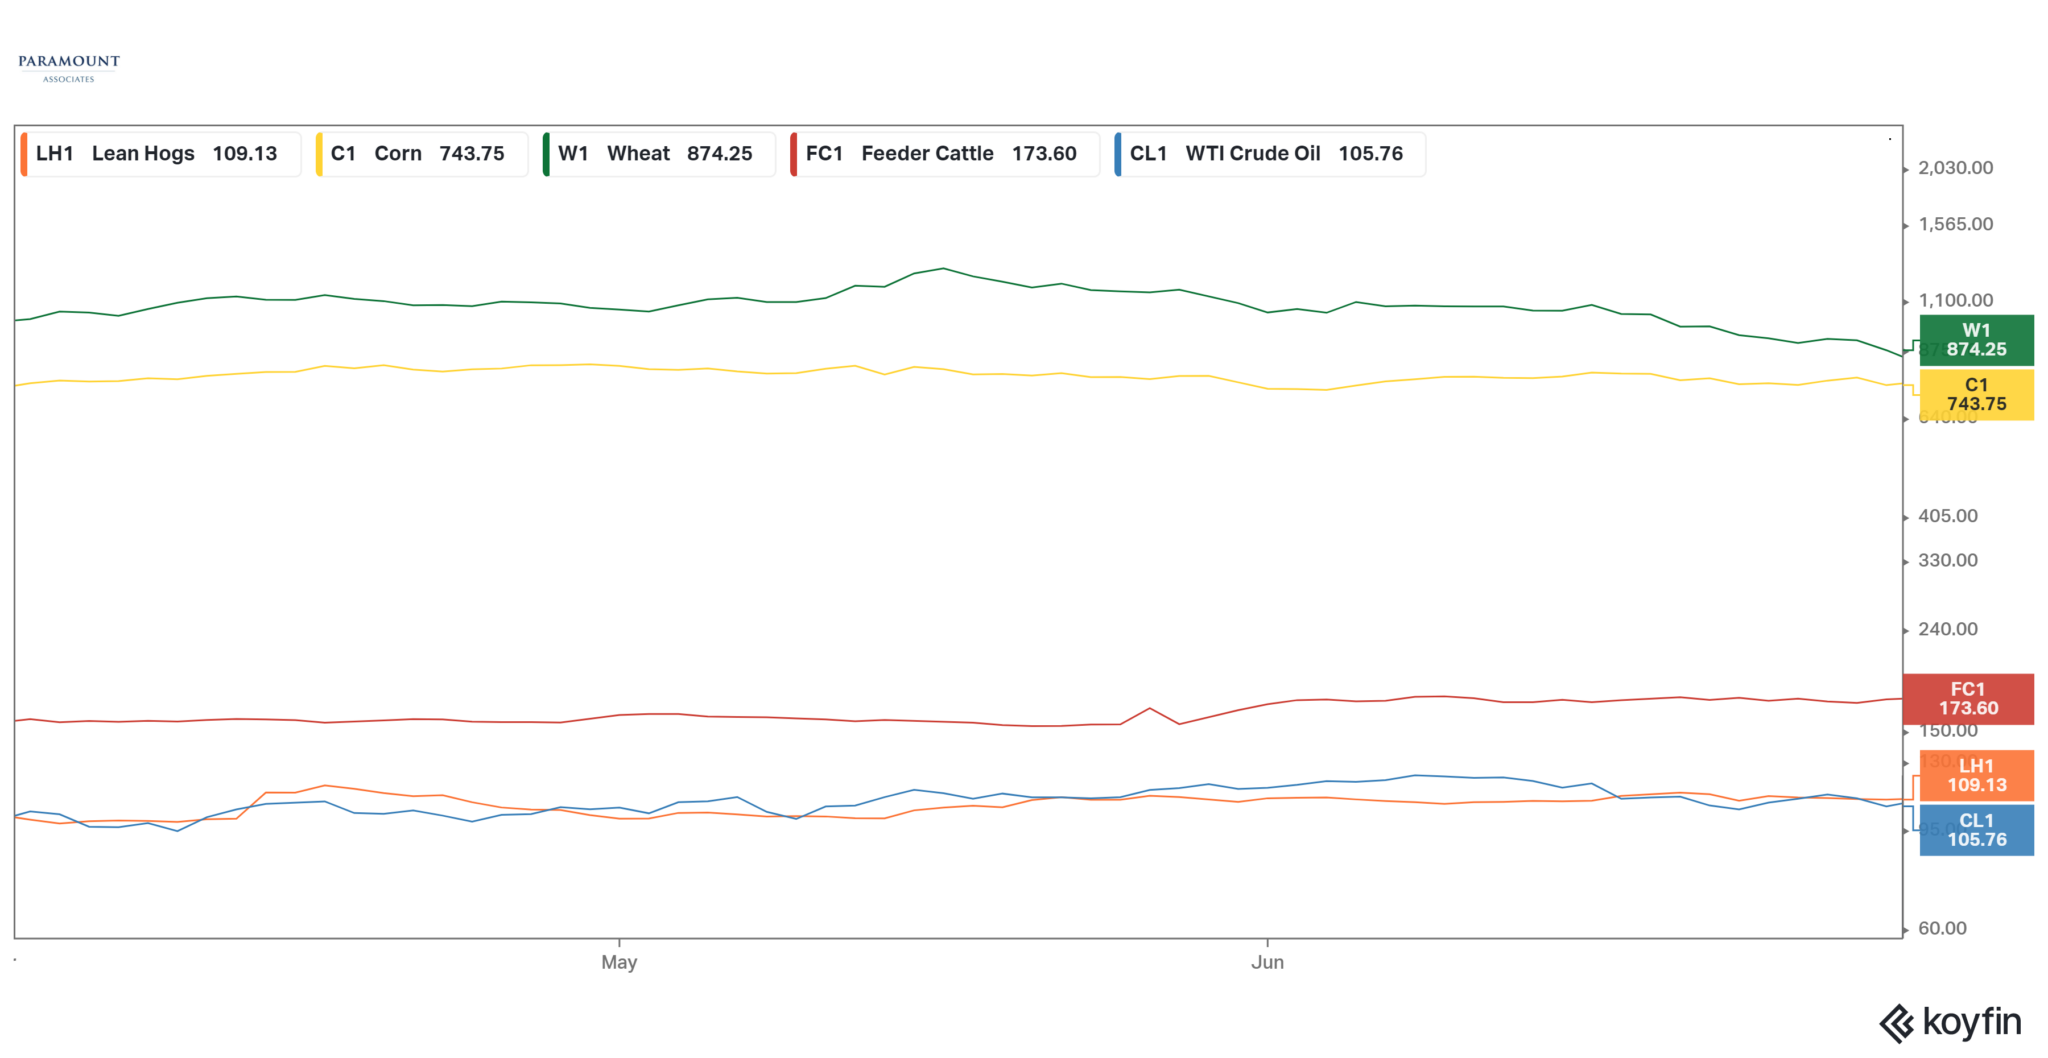
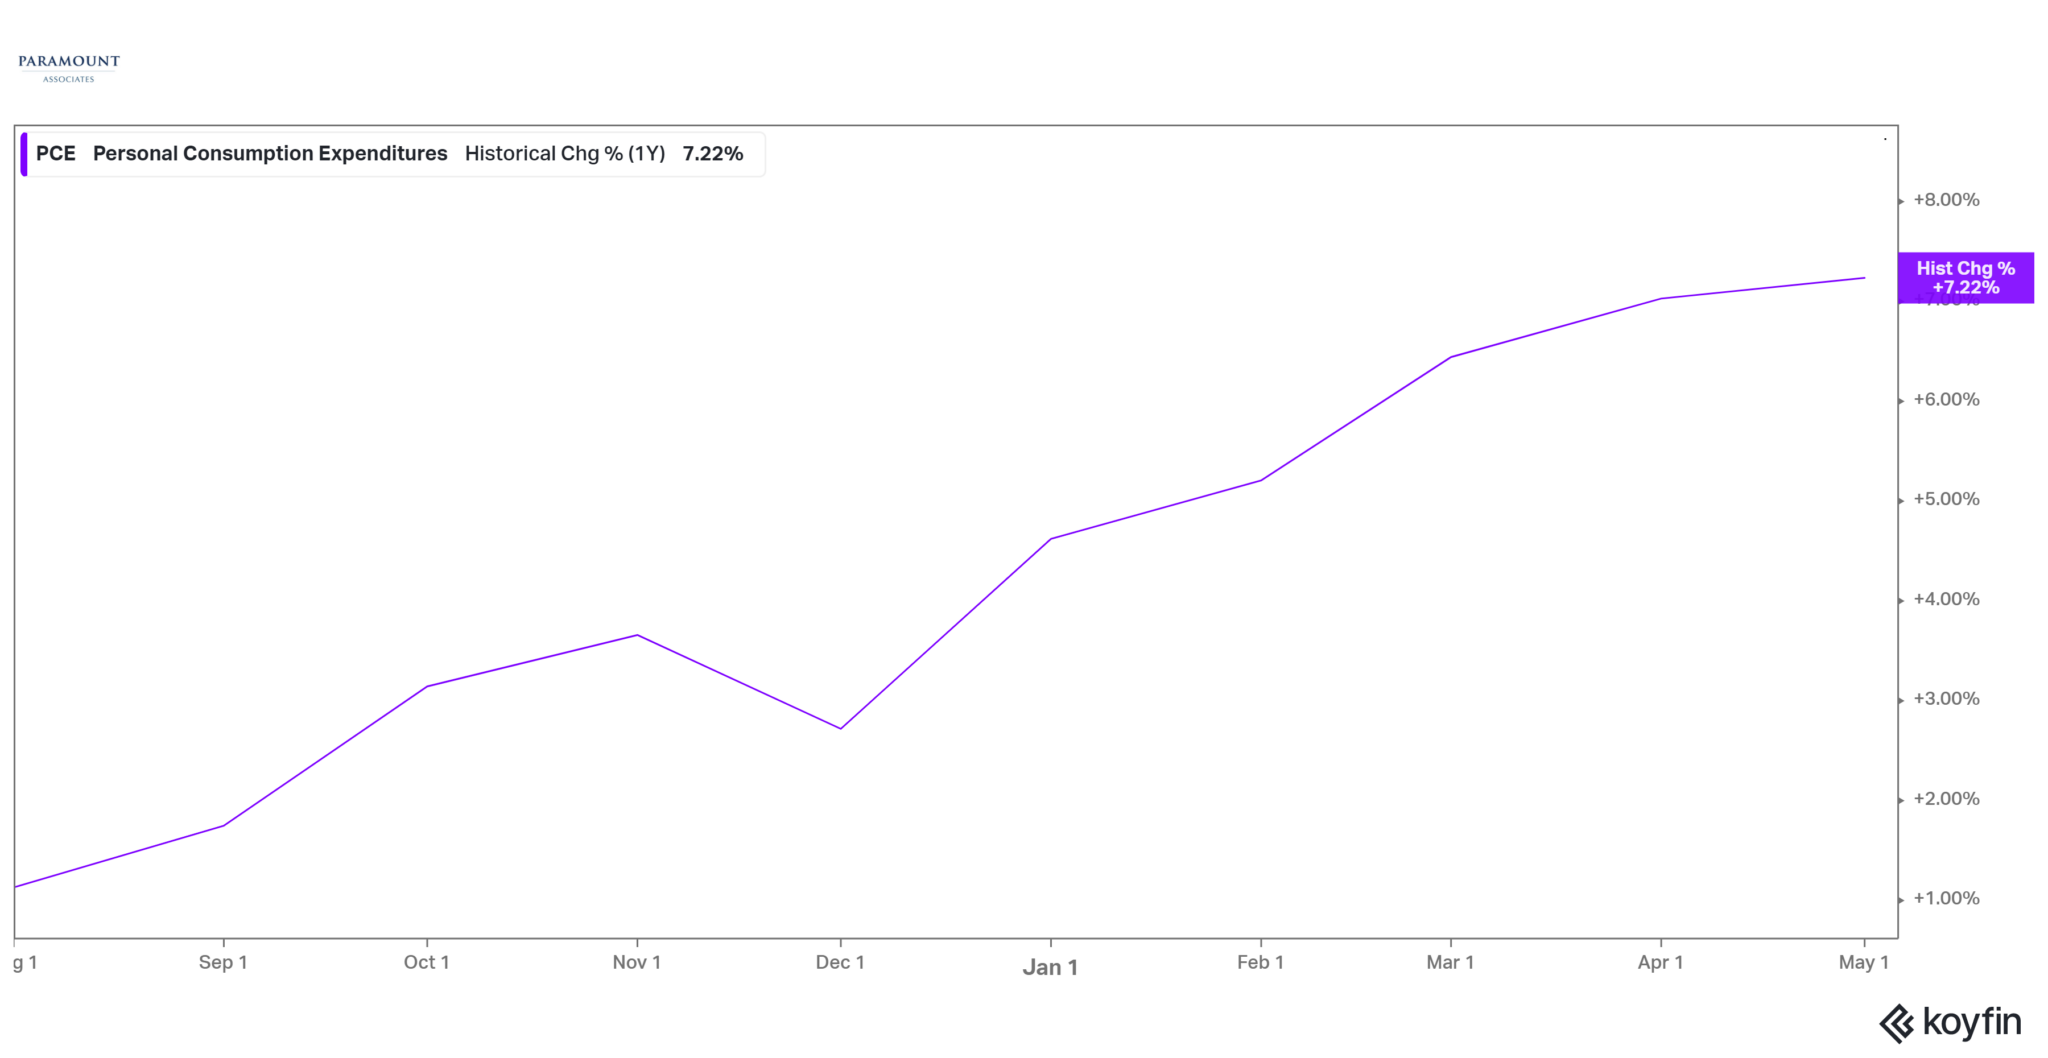
I focus on food and gas because these are the sectors where inflation is felt the most. Taking food and gas out of the equation, and focusing on the index the Federal Reserve uses to make policy decisions, we may be seeing the same ‘topping’ activity in the PCE (Personal Consumption Expenditures) Index. (For more information on CPI vs PCE: Paramount Insights: CPI vs PCE)
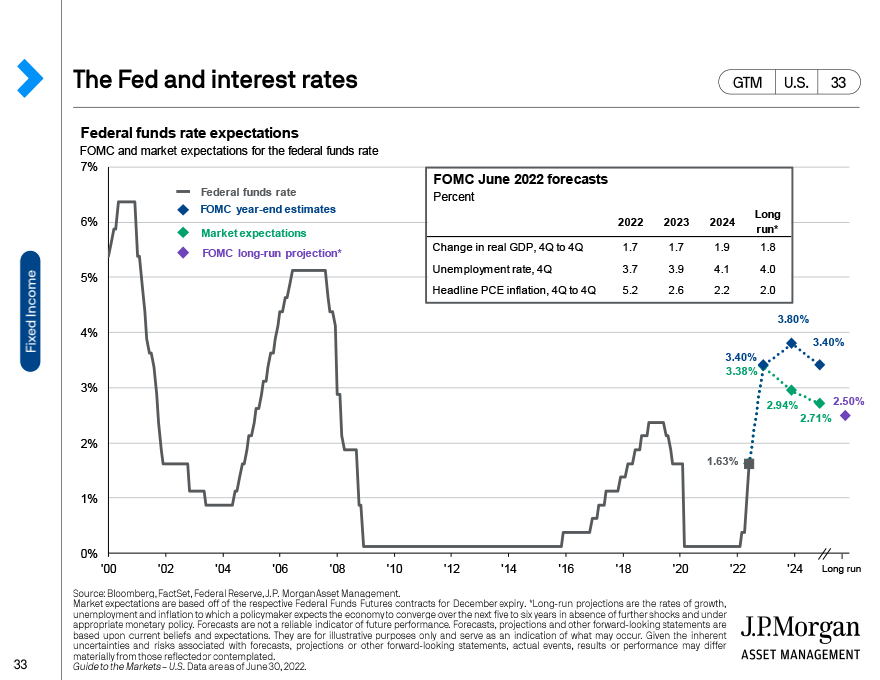
What is the market expecting? Remember that markets (stocks and bonds) attempt to price in the Federal Funds Rate before the Federal Reserve actually increases/decreases rates. The market expects the Federal Funds Rate to finish 2022 around 3.35%. I believe this is on the high side of my expected range of 3.15% – 3.35%. Additionally, if there is a surprise – I believe the surprise is to the low-end and the Federal Reserve does not reach 3.15%. This may happen if the demand side of inflation naturally decreases, pulling down the price of goods.
CORPORATE PROFITS: Before I get into estimates let’s review where we have been. S&P 500 2017 EPS (Earnings Per Share Growth): +17%, 2018 EPS: +22%, 2019 EPS: +4%, 2020 EPS: -22%, 2021 EPS: +70%4. There are a few different ways to frame these five years of earnings growth: Total EPS Growth = 96.84%, Arithmetic Mean (no compounding) = 18.20%, Geometric Mean (compounding) = 14.50%. Let’s now compare this with historical averages: The average EPS Growth from 2001 – 2021 was 9.1%4. This means that corporate earnings have increased nearly 60% more per year (using geometric mean) than the last 20 year historical average. Any number used to demonstrate this will exhibit robust growth in corporate earnings for the last five years.
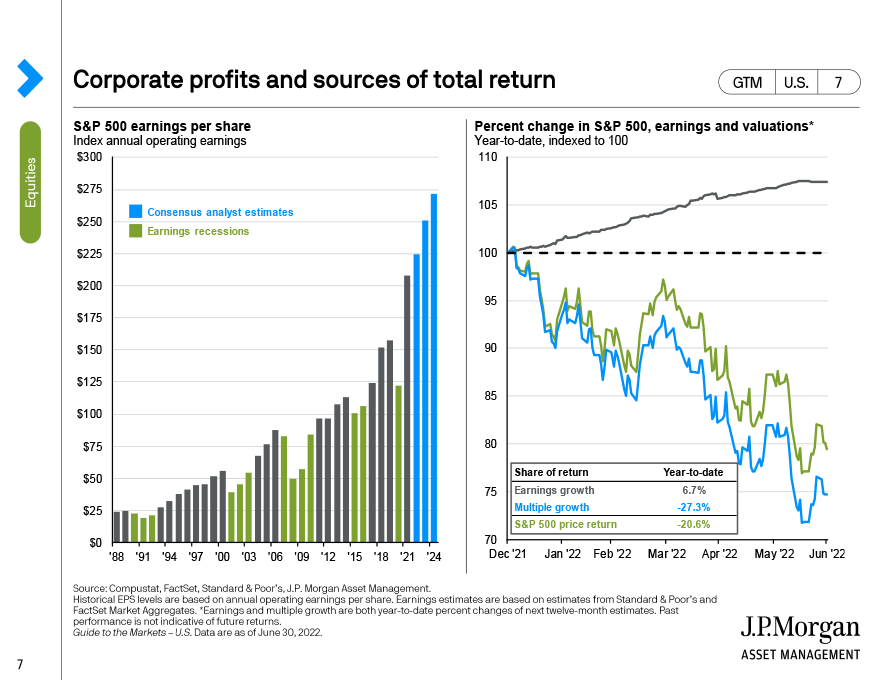
That’s where we have been. So where are we now? Starting with revenues: For Q2 2022 the S&P 500 is expected to report (year-over-year) revenue growth of 10.1%5. If 10.1% is the actual growth rate for the quarter, this will mark the sixth-straight quarter of double digit revenue growth. This leads to earnings: Analysts currently predict earnings growth for 2022 of 10.2%5. In total, revenues have continued to grow and earnings growth is expected above the 20-year average.
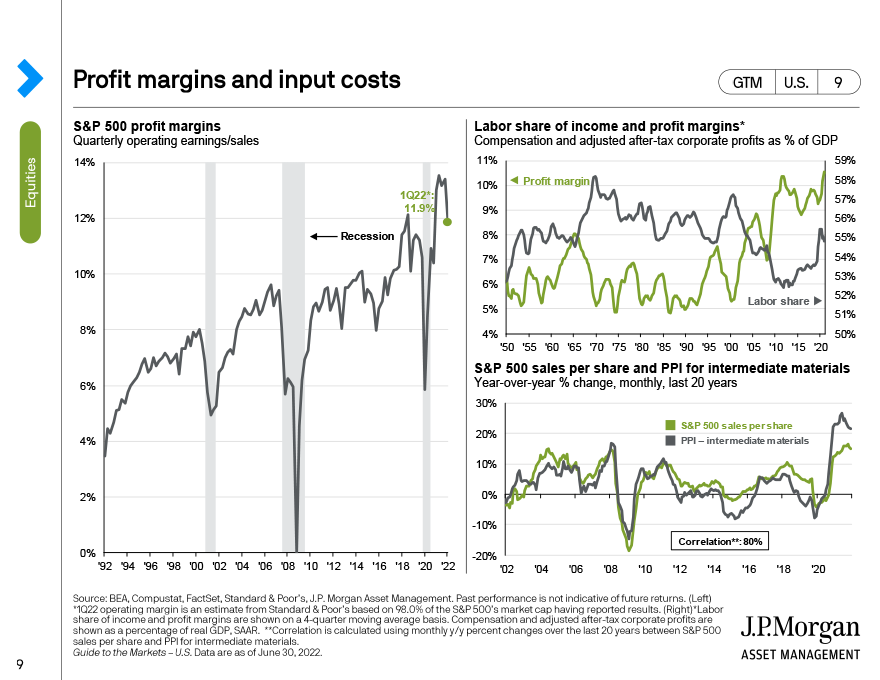
Another concern for Corporate Profits are input costs. Wages are increasing (+5.1% as of June, 20226) at the same time as prices for goods/services used to create revenue (Producer Price Index PPI +10.8% as of May 20227) are increasing. This will drag on corporate profits, however U.S. corporations enjoyed record profit margins throughout 2021. Profit margin is the amount that revenue exceeds the cost of business. When the cost of business increases (wages, costs of goods sold), profit margins compress and that can reduce earnings. I do expect some reduction in earnings due to costs; considering the record margin levels beginning 2022, I do not expect the impacts to be as aggressive as current market expectations.
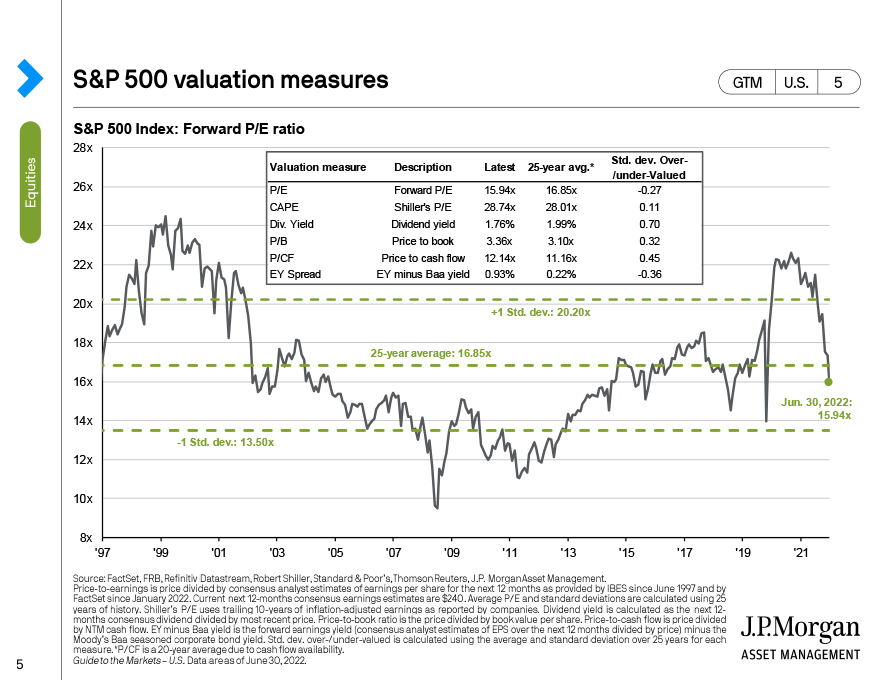
VALUATIONS: Over the past nine months there has been ‘multiple compression’ in equities. The definition of multiple compression is: an effect that occurs when a company’s earnings increase, but its stock price does not move in response8. Alternatively, earnings may increase and stock prices may drop. Using the straightforward P/E (price/earnings) valuation method, simple math presents two pathways to lower valuations. This year alone, valuations have dropped nearly -30% due to lower prices, and valuations are now below historical averages. This means on average stocks are selling below their true intrinsic (fundamental) values.
RECESSION:
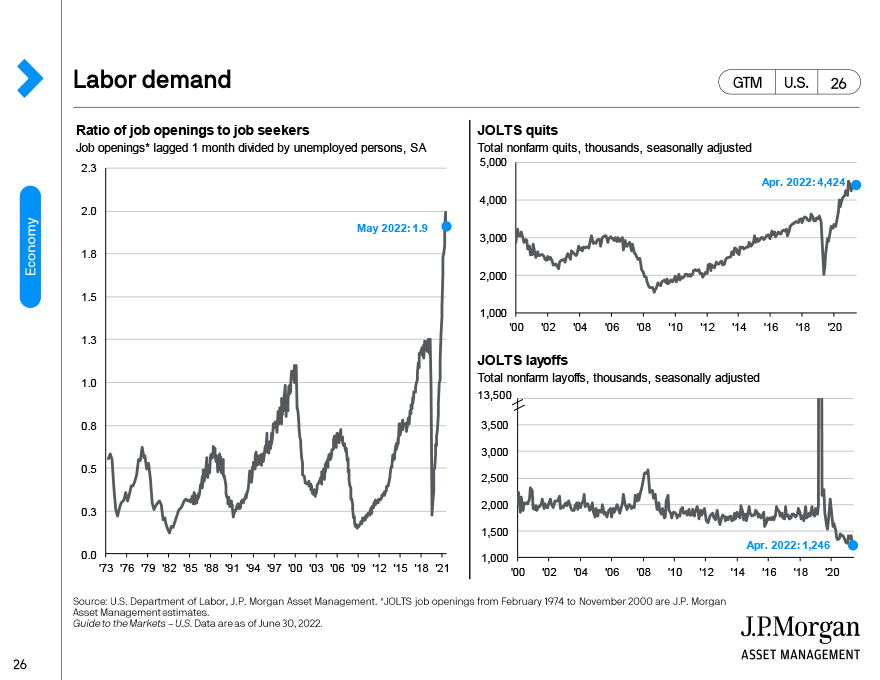
I do not believe the United States will enter a Recession in 2022. Why? One answer – Employment. Even with job openings decreasing to 11.3 million9 in May, there are more than enough jobs for the 5.9 million10 workers looking for jobs. Tightness in the job market comes from consumer demand and a reduction in qualified workers. Last year alone 48 million11 quit their jobs; this is a large percentage of the approximately 164 million10 workers in the United States workforce. In fact, the strength continues into June with nonfarm payrolls adding another 372,00010 workers and the unemployment rate hanging on at 3.6%10. Without high unemployment I do not believe a recession is on the horizon. I also feel sustained corporate earnings and discounted valuations make a compelling argument against recession in the United States. If the United States does enter a recession (by some technical assumption), I feel it would be the most atypical recession ever. Do you remember a recession with rising wages and employment? If we do enter a recession (by some technical analysis), I don’t expect it would last long nor do I expect it be would more noticeable than a press release.
WHERE DO WE GO FROM HERE?
Investors need to remember where we are coming from as it relates to: Where do we go from here? We have experienced earnings growth 60% higher than average, profit margins at all-time highs, cheap borrowing costs, incredible amounts of fiscal stimulus, and low unemployment.
Yes, inflation is higher than first predicted. Yes, borrowing costs have increased. There are other factors that aren’t as robust as last year, however there is a big difference between ‘slowing growth’ and an ‘economic recession’.
I do expect the market (bond and stock) volatility to continue. I do expect the stock market to appreciate between now and the end of the year. I am fundamentally ready to increase allocations to risk assets. There are opportunities emerging around the globe – demonstrated by the Global Rankings below. If you have interest in learning more on my current investment strategy and learning fundamental strategies for periods of market volatility please register (MARKET VOLATILITY REGISTRATION) for my upcoming webinar: Strategies for Market Volatility on July 19th from 5:00pm-6:00pm MST. Remember, the best buying opportunities for risk assets are when the consensus is at its very lowest.
Scott Tremlett, CFP®, ChFC® Chief Investment Strategist
Paramount Mid-Year Global Rankings
(as of June 2022)

#1. Brazil
Current Power: 1 – Top 3 in GDP Growth, Composite PMI, & Manufacturing PMI Current Categories
Momentum: 3 – #1 in GDP Growth Momentum Category
Overall Rank: 1 – Top 10 in every Category, Top 5 – 5 of 8 Categories

#2. China
Current Power: 4 – #1 LEI & GDP Growth Current Categories
Momentum: 1 – #1 Composite PMI & Manufacturing PMI Momentum Categories
Overall Rank: 2 – Top 10 – 7 of 8 Categories

#3. India
Current Power: 2 – Top 5 in every Current Category
Momentum: 3 – #1 LEI Momentum Category
Overall Rank: 3 – Top 10 in every Category, Top 5 – 6 of 8 Categories

#4. Mexico
Current Power: 7 – #3 GDP Growth Current Category
Momentum: 2 – #2 GDP Growth & Manufacturing PMI Momentum Categories
Overall Rank: 4 – Top 3 – 3 Categories

#5. Australia
Current Power: 4 – Top 5 LEI, GDP Growth, & Manufacturing Current Categories
Momentum: 9 – Top 3 LEI & Manufacturing PMI Momentum Categories
Overall Rank: 5 – Top 5 – 5 of 8 Categories

#6. United States
Current Power: 10 – #4 LEI Current Category
Momentum: 5 – #4 Manufacturing PMI Momentum Category
Overall Rank: 6 – Top 10 – 7 of 8 Categories

#7. Canada
Current Power: 3 – #2 Manufacturing PMI Current Category
Momentum: 12 – 3rd to last Manufacturing PMI Momentum Category
Overall Rank: 7 – #3 Current Category

#8. United Kingdom
Current Power: 12 – Top 6 – 3 of 4 Current Categories
Momentum: 8 – Top 5 – 3 of 4 Momentum Categories
Overall Rank: 8 – #5 Composite PMI Current Category & #5 Composite PMI Momentum Category
REFERENCES
1National Bureau of Economic Research; Frequently Asked Questions; accessed 7/02/2022
2Morningstar; Index Performance; accessed 7/02/2022
3Morningstar.com; Quotes and Site: AGG; accessed 7/02/2022
4JP Morgan; Guide to the Markets Q3 2022; David P Kelly, Jordan K Jackson, David M Lebovitz, John C Manley, Meera Pandit, Gabriela D Santos, Stephanie Aliaga, Sahil Gauba, Olivia C Schubert and Nimish Vyas; accessed 7/03/2022
5Factset; Earnings Insights; John Butters; accessed 7/05/2022
6Bureau of Labor Statistics, US Department of Labor; Employment Situation; accessed 7/08/2022
7Bureau of Labor Statistics; Producer Price Indexes; accessed 7/08/2022
8Investopedia; Multiple Compression; accessed 7/08/2022
9US Bureau of Labor Statistics; Job Openings and Labor Turnover Survey; accessed 7/08/2022
10US Bureau of Labor Statistics; BLS News Release; accessed 7/08/2022
11Edsmart; The Great Resignation Statistics; accessed 7/05/2022
DISCLAIMER
The views expressed represent the opinion of Paramount Associates. The views are subject to change and are not intended as a forecast or guarantee of future results. This material is for informational purposes only. It does not constitute investment advice and is not intended as an endorsement of any specific investment. Stated information is derived from proprietary and non-proprietary sources believed to be correct and current, but it should not be regarded as complete, an endorsement or personalized investment advice. Forward looking statements are speculative and based on assumptions as well as known and unknown risk and uncertainties. Past performance is not indicative of future results. The appropriate- ness of an investment or strategy will depend on an investor’s circumstances and objectives. These opinions may not fit to your financial status, risk and return preferences. Nothing contained herein constitutes financial, legal, tax, or any other type of advice. A professional advisor should be consulted before implementing any investment strategy.
Paramount Associates
6400 S. Fiddlers Green Circle Suite 1310
Greenwood Village, CO 80111
(720) 463-0020
general@paramountassoc.com
www.paramountassoc.com
www.linkedin.com/in/paramount-associates-623692197
@paramountassociatesdenver